Fiona and matplotlib: simply plotting features
Fiona goes very well with matplotlib and descartes.
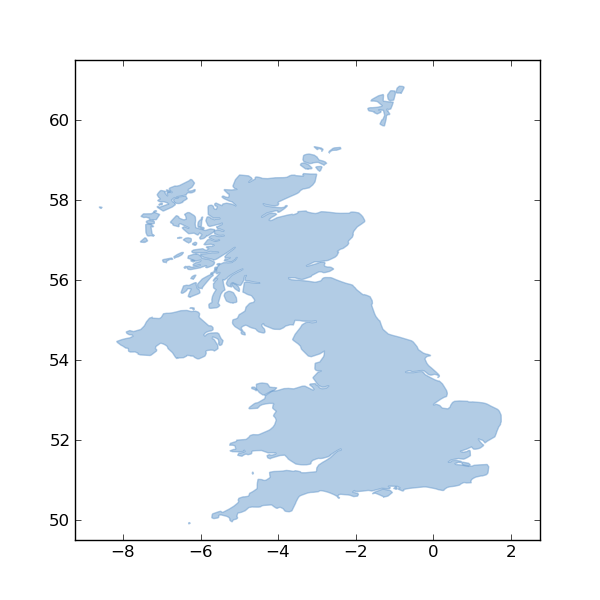
from matplotlib import pyplot
from descartes import PolygonPatch

from fiona import collection

# Set up the figure and axes.
BLUE = '#6699cc'
fig = pyplot.figure(1, figsize=(6, 6), dpi=90)
ax = fig.add_subplot(111)

# For each feature in the collection, add a patch to the axes.
with collection("docs/data/test_uk.shp", "r") as input:
    for f in input:
        ax.add_patch(
            PolygonPatch(
                f['geometry'], fc=BLUE, ec=BLUE, alpha=0.5 ))

# Should be able to get extents from the collection in a future version
# of Fiona.
ax.set_xlim(-9.25, 2.75)
ax.set_ylim(49.5, 61.5)

fig.savefig('test_uk.png')
The resulting image:
I value simplicity. The problems I work on are complex and tools with extra, incidental complexity wear me out needlessly. How about you? Fiona, unlike other geospatial software, is designed to be simple.
Comments
Re: Fiona and matplotlib: simply plotting features
Author: Reinout van Rees
Wow, this looks neat. The simplicity here and in your previous example make it feel very thought-out and practical.
I have a django project where we use shape files. Small errors in them keep bringing parts of sites down. Sending them through Fiona and using the filtered and clean geojson output should help a lot. And simplify our code a lot.
Now all I have to do is get rid of my back pain and start experimenting with this. I already sent off an email to work to look at this :-)
Re: Fiona and matplotlib: simply plotting features
Author: Sean
Well, remember that my earlier script only gets out mild stains. Geodata is about as dirty as data gets.